This is the first in a five part series on crash data analysis sponsored by Lawyer Jim Freeman.
Pedestrians and bicyclists involved in hit-and-run traffic crashes with automobiles in Chicago receive more injuries and die more often than pedestrians and bicyclists involved in hit-no-run crashes while drivers and passengers have the opposite outcome. This post attempts to describe the situation of hit-and-run crashes in Chicago.
On Sunday I wrote that 75% of all pedestrian traffic deaths this year were in hit-and-run crashes; it’s important to know that all the offending drivers were later apprehended (note 1). The horrific events on Saturday made me curious: How prevalent are hit and run crashes? I already know that our hit-and-run rate is 28.5% for 2005-2010, but how does that translate into frequency of injuries and fatalities? Are hit-and-run crashes worse for drivers, passengers, pedestrians, and cyclists? Better than hit-no-run crashes? I ran a few calculations to find the answers. I came up with more questions than answers, but my initial interpretation is that hit-and-run crashes are not much better or worse than hit-no-run crashes when looking at every crash participant combined.
One piece of information that would make this analysis richer is knowing in how many cases of hit-and-run crashes that police do not apprehend the offender, and how frequent the offender is convicted as part of the crash, or had the charges dropped. I’ve just now begun to look for that information.
So here’s how I determined that hit-and-run crashes are no worse than hit-no-run crashes. I looked at the injury and fatality outcomes of pedestrians, “pedalcyclists” (bicyclists), drivers, and passengers in both hit-and-run and hit-no-run crashes. Firstly, though, pedestrians are more likely to experience a hit-and-run crash than bicyclists. Secondly, the bicyclist crash rate (24.4% from 2005-2010) is lower than the rate for all crash types (28.5%) and pedestrians (32.7%).
13.8% more cyclists died in hit-and-run crashes than hit-no-run crashes, but there are so few bicycling deaths that the calculated results are insufficient upon which to make conclusions. More cyclists had a “no injury” outcome in hit-and-run crashes than hit-no-run crashes. Cyclists in hit-and-run crashes were 3% more likely to receive an “incapacitating injury” than cyclists in hit-no-run crashes. They were 4.2% less likely to receive a “non-incapacitating injury” and 7% more likely to receive a “possible injury”. Again, sample sizes are so low that interpreting what this means is not an easy task (see Selected statistics below).
32.9% more pedestrians died in hit-and-run crashes than hit-no-run crashes. Like cyclists, more pedestrians had a “no injury” outcome in hit-and-run crashes than pedestrians in hit-no-run crashes. Pedestrians in hit-and-run crashes were less likely to receive “incapacitating” and “non-incapacitating” injuries than those pedestrians involved in hit-no-run crashes, but more likely to receive a “possible injury”.
The situations for automobile passengers and automobile drivers (without segregating by which kind of vehicle they occupied or drove) is wildly different. Based on my calculations it looks as if drivers and passengers in hit-and-run crashes outlive drivers and passengers in hit-no-run crashes. If these data tell me why, I’m not seeing it.
One last harrowing group of statistics: pedestrians represent 1.3% of all people (note 2) involved in traffic crashes, but represent 20.8% of all people who die in traffic crashes. The situation is less disproportional for bicyclists: they represent 0.6% of all people involved in traffic crashes and 2.9% of all people who die in traffic crashes. Looking at only hit-and-run crashes, the disproportion grows: pedestrians represent 2.1% of all people involved in hit-and-run crashes, but represent 65% who die and bicyclists represent 0.7% of all people in hit-and-run crashes, but represent 4.9% who die.
Like all my analyses, these are only initial forays to finding the best information to guide policy and enforcement decisions. My analysis did not look at the injury rate for bicyclists and drivers involved in the same crash; it only looked at aggregated users.
Other questions to ask:
- What causes somebody to hit then run? Are there demographic predictors, or is more based on situational factors, or attributes of the victim?
- What exactly is the law that requires people to stop after a crash? When does a crash become a hit-and-run? Can there be a hit-and-run if both parties stop but one leaves prematurely?
- How many people are caught? How many people are prosecuted?
- Is the prevalence of hit and run driving really a problem? It’s a problem from a justice standpoint, but not really from an injury standpoint (until you break down stats into modes).
- The reason someone will stay (not run) in a crash might be based on severity. How do I set up a query to learn that?
- People will stop and help their victim. Some people won’t. What’s the difference between these people?
- What are the legal outcomes of these crashes? We can connect highway crash outcomes with medical outcomes, but what about connecting these crashes with legal outcomes (whether an offender was convicted)?
- Are hit and run crashes something to care about and spend time specifically addressing, like how the police often have stings for DUIs?
- What kind of public discourse do I want to start with this and similar articles?
- How do I set up the structure of watching the news, watching the stats. As people increasingly bike, people are going to pay attention more and more.
- Why are certain people who die emphasized in news media reporting? Why are other people ignored? In other words, of the 315 people who died in traffic crashes in 2010, how many got a newspaper article written about them? Streetsblog San Francisco reports on two recent crashes there that received different coverage.
- Can the violent crime location predicting tool the Chicago police have work for traffic crashes?
- Where do hit-and-run crashes occur? Are these different than hit-no-run crashes?
- It’s implied in all traffic models that you can predict where crashes will occur. Is that information being used to predict and prevent traffic crashes?
- How great of a public health issue is this? Can our knowledge about communicable (like flu or STDs) and incommunicable diseases (like diabetes) translate to preventing or mitigating traffic crashes?
- Would a project set up like CeaseFire help reduce the prevalence of hit-and-run crashes? (note 3)
I eagerly wait traffic enforcement plans from transportation commissioner Gabe Klein and police superintendent Garry McCarthy. Klein consistently mentions enforcement as a strategy he wants to try to make safer streets, but I’ve yet to hear anything about it since the last time.
View my spreadsheet as a PDF. If you would like to verify my calculations, I can send you the relevant part of the Excel spreadsheet. I’m not publishing it because it’s not well-formatted and needs instructions. See past reporting of hit-and-run crashes.
[flickr]photo:5665943713[/flickr]
The crash data I analyze is all based on traffic crash reports like this.
Selected stats
2005-2010
Total cyclists killed in crashes with automobiles: 33 (9 in hit-and-run, 24 in hit-no-run)
Total cyclist-automobile crashes: 9,366 (2,292 hit-and-run, 7,074 hit-no-run)
Total pedestrians killed in crashes with automobiles: 283 (119 in hit-and-run, 164 in hit-no-run)
Total pedestrian-automobile crashes: 20,894 (6,833 hit-and-run, 14,061 hit-no-run)
Notes
1. Calvin, a sometime contributor, had some questions about the hit-and-run on early Saturday morning where the police caught the 21-year-old driver a block later: how did they catch her a block later? Did she stop a block later realizing the horror of the situation? Michelle, another occasional contributor, suggests, “She didn’t stop because she realized the horror of it. There are enough people around that area 24/7 who witnessed it that they could track her down as she tried to get away.”
2. All persons involved in traffic crashes means automobile drivers and passengers, pedestrians, and pedalcyclists (bicyclists). I’ve excluded equestrian, occupant of non-motorized vehicle, and non-contact vehicle.
3. I’ve never known how CeaseFire operates until my friend William mentioned it to me. I looked on their website to see how it works:
We maintain that violence is a learned behavior that can be prevented using disease control methods. Using proven public health techniques, the model prevents violence through a three-prong approach:
1) Identification & detection, 2) Interruption, Intervention, & risk reduction, and 3) Changing behavior and norms
4. The dataset I have does not include crashes without automobiles. For example, there are no bike-pedestrian or bike-bike crashes counted here.
P.S. I began this post, like many I write, thinking I could easily write and quickly run queries against the database on my computer that holds the crash data from the Illinois Department of Transportation. Easily and quickly is never the case with crash data analysis. It took me 4-5 hours to grab the information and write the article. Thank you to William Vassilakis for some advice on what to write and analyze. I do not have data for any other cities. You can hire me to perform such an analysis for your town.
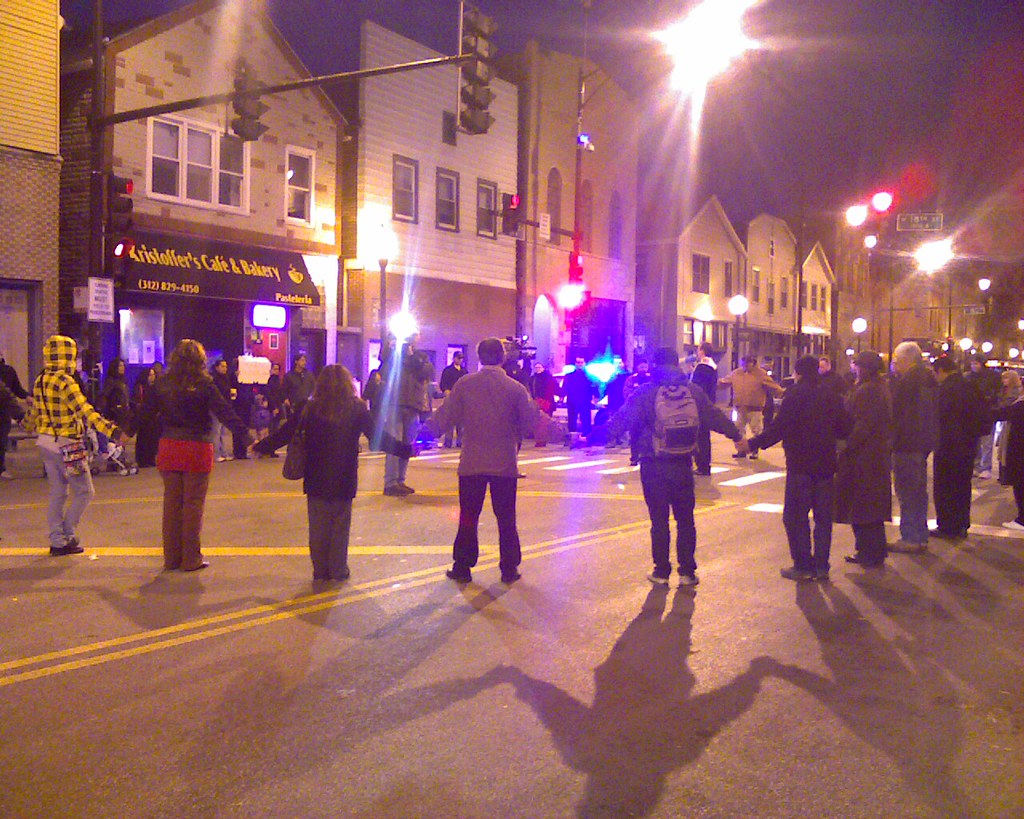
Photo by Audrey Thibeau shows a prayer circle of residents, friends, and family of Martha Gonzales, who was killed in Pilsen on Halsted by a hit-and-run driver in 2009, who was never apprehended. I wrote about her story and distracted driving on Steven Can Plan at that time. Updated 9:11 to add Selected statistics, to improve the figures in the fifth and sixth paragraphs, and to add more info to note 1.
I have a theory regarding the lower fatality rates among drivers and passengers in hit-and-run crashes versus hit-no-run: given a static rate of people predisposed to run after a crash, hit-no-run crashes will include a number of predisposed runners who are unable to run because of a severe crash (incapacitated or vehicle immobilized). That is, hit-no-run crashes will be more severe on average.
I concur. I suspect that if the pool of likely runners is x then x/y where y=undrivable vehicle will give a set of injured drivers and passengers.
Nice job, Vance.
Thank you for that theory, Erik. It seems sensible.
I hope to start some public discourse with this information and the probing questions I’ve listed in the article.
No one wants to talk about hit-and-run crashes. Actually, transportation commissioner Klein has mentioned it at least once, but there’s no plan yet.
This is a very good set of questions. Erik raises a good point about hit-no-run crashes.
I wish I had some good answers to these difficult questions. Thanks for putting the time into this excellent article. The topic needs further investigation.
The topic definitely needs further investigation. I’m sure that some of the questions I posed have been addressed or even answered by some academic research, which I haven’t searched yet.
Simultaneously, though, I think I’ve done a sufficient job in identifying hit-and-run crashes as a “problem”. The next step is to figure out how to mitigate and eliminate this problem.
Do you think there ought to be a “grace period” for “hit and run” drivers to turn themselves in, as long as they “come clean”? If people who are told they have cancer, hear nothing more the Dr. says that visit, how much more may sheer panic and mental paralysis grip a driver who has just struck someone and assumes they are dead? Even a 12 hour grace period may solve many hit and runs much more quickly than the way we go about dealing with it now.
When I first read this, I was thinking, “absolutely not”. But then I thought how I might react if I hurt someone with my vehicle. I would probably want to get away, because I’d be very embarrassed and ashamed. But I know I’d want to do what is right.
A grace period might be a good thing to find the perpetrator.